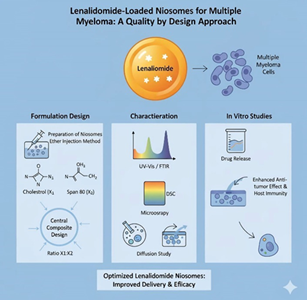
Graphical Abstract
Formulation, Evaluation and optimization of Lenalidomide loaded niosomes
Summary
The targeted and sustained delivery of anticancer drugs remains a major focus in pharmaceutical research to enhance therapeutic efficacy and reduce systemic toxicity. This study involves the formulation, evaluation, and optimization of Lenalidomide-loaded niosomes for improved drug delivery in cancer therapy. Niosomes were prepared using the ether method technique with non-ionic surfactants (Span 80 and cholesterol) in varying molar ratios. A series of formulations were developed and optimized based on particle size, polydispersity index (PDI), and entrapment efficiency (EE%). The optimized formulation was characterized for morphology, zeta potential, in-vitro drug release, FTIR, DSC, and stability studies. Results indicated that the optimized niosomal formulation exhibited nanometric size, high entrapment efficiency, and controlled drug release over 8 hours. The findings highlight the potential of niosomal carriers to enhance the bioa vailability and therapeutic performance of Lenalidomide, offering a promising approach for the effective and sustained management of multiple myeloma and related malignancies.
Keywords
Lenalidomide; multiple myeloma; niosomes; ether injection method
Introduction
Niosomes are multi lameller vesicular structure of non-ionic surfactants, similar to liposomes and are composed of non-ionic surfactant instead of phospholipids which are the components of liposomes. [1,2] So, niosome or non-ionic surfactant vesicles are now widely studied as an alternative tool to liposome. Various types of surfactants have been reported to form vesicles, and have the capacity to entrap and retain the hydrophilic and hydrophobic solute particles [1-3]. Niosomes are vesicular nanocarriers that are stable, non-toxic, biodegradable, and reasonably priced. The instability, rapid disintegration, bioavailability, and solubility of some drugs or natural substances may be improved by niosomes. When it comes to the targeted administration of antibacterial, antimicrobial, anti-inflammatory, antioxidant, and anticancer compounds, niosomes have the potential to be incredibly powerful systems. This essay will provide a summary of their makeup, the most popular methods for formulation, and their present application as delivery systems for cancer treatments. [4]
Accumulating evidence suggests that this residual risk cannot be fully explained by neurohormonal activation alone. Instead, chronic endothelial dysfunction, oxidative stress, and impaired myocardial relaxation play central roles in disease progression. Oxidative stress reduces nitric oxide (NO) bioavailability and oxidises the haem moiety of soluble guanylate cyclase (sGC), leading to diminished conversion of guanosine triphosphate to cyclic guanosine monophosphate (cGMP). Deficiency of cGMP signalling contributes to impaired myocardial relaxation, increased ventricular stiffness, progressive fibrosis, and adverse vascular remodelling [4,5].
Niosomes mainly contain two types of components i.e., non-ionic surfactant and the additives. The non-ionic surfactants form the vesicular layer and the additives used in niosome preparation are cholesterol and the charged molecules.[3] The presence of the steroidal system (cholesterol) improves the rigidity of the bilayer and is important component of the cell membrane and their presence in membrane affects bilayer fluidity and permeability. This carrier system protects the drug molecules from the premature degradation and inactivation due to unwanted immunological and pharmacological effects.[5] By guaranteeing that noisome medications are distributed in a controlled manner that is customized to the needs of the patient, this innovation not only expedites the formulation process but also enhances therapeutic outcomes. [6]
In recent years, niosomes have been extensively studied for their potential to serve as a carrier for the delivery of drugs, antigens, hormones and other bioactive agents. Besides this, niosome has been used to solve the problem of insolubility, instability and rapid degradation of drugs.[7] Niosomes can be categorized into 3 groups based on their vesicle size, namely, small unilamellar vesicles (0.0.25–0.05 mm), multilamellar vesicles (>0.05 mm), and large unilamellar vesicles (>0.10 mm) [8].
Lenalidomide (previously referred to as CC-5013) is an immuno modulatory drug with potent antineoplastic, anti-angiogenic, and anti-inflammatory properties. It is a 4-amino-glutamyl analogue of [thali domide] and like thalidomide, lenalidomide exists as a racemic mixture of the active S(-) and R(+) forms However, Lenalidomide is much safer and potent than thalidomide, with fewer adverse effects and toxicities.[9] Thalidomide and its analogues, including Lenalidomide, are referred to as immuno modulatory imide drugs (also known as cereblon modulators), which are a class of immuno modulatory drugs that contain an imide group. Lenalidomide works through various mechanisms of actions that promote malignant cell death and enhance host immunity Available as oral capsules, Lenalidomide is approved by the FDA and EU for the treatment of multiple myeloma, myelodysplastic syndromes, mantle cell lymphoma, follicular lymphoma, and marginal zone lymphoma in selected patients. [10,11]
Multiple myeloma is a clonal B-cell malignancy associated with a monoclonal (M) protein in blood and/or urine, bone lesions, and immunodeficiency. It usually evolves from monoclonal gammopathy of undetermined significance (MGUS), with low levels of plasmacytosis and M protein without osteolytic lesions, anemia, hypercalcemia, and renal failure.[11] Multiple myeloma is characterized by genetic signatures, including frequent translocations into the immunoglobulin heavy chain switch region (IgH), oncogenes, and abnormal chromosome number[12,13]. Most patients with translocations have non-Hyperdiploid chromosome number (NHMM), while those patients lacking IgH translocations have Hyperdiploid chromosome number (HMM) with trisomies of chromosomes 3, 5, 7, 9, 11, 15, 19, and 21. Importantly, patients with Hyperdiploid multiple myeloma have a better outcome with prolonged survival [14, 15].
Lenalidomide has a short plasma elimination half-life of about 3–4 hours, which necessitates frequent doses to maintain therapeutic levels and exposes patients to varying systemic exposure despite its excellent oral absorption and bioavailability.[16] Additionally, dose-limiting toxicities including neutropenia and thrombocytopenia, which limit dose escalation and overall acceptability in multiple myeloma therapy, are correlated with increased systemic exposure to lenalidomide. These characteristics imply that, in comparison to conventional dosing, a sustained and targeted delivery platform such as niosomes, which have been demonstrated to improve drug stability, control release, and delivery to diseased tissues, may extend systemic exposure, lower off-target toxicity, and increase therapeutic efficacy [17].
Results and Discussion
Pre-formulation studies
a. Physical parameters of Lenalidomide
To determine Lenalidomide's fundamental physicochemical properties, its appearance and solubility were assessed. The substance
was found to be a crystalline powder that was off-white to pale yellow in colour, indicating good purity and a constant physical
form. Water, methanol, ethanol, and acetone were among the solvents used for solubility tests. Lenalidomide was found to be
nearly insoluble in water, but it was more soluble in acidic (low pH) solutions and organic solvents such methanol, ethanol, and
diethyl ether. Using the capillary tube method, the drug's melting point was found to be 272.36 °C, which is consistent with the
range reported for pure Lenalidomide and validates the drug's identity and thermal stability.
b. Calibration curve
Calibration curve was plotted in methanol at 242 nm. The calibration curve was plotted as seen in figure1.
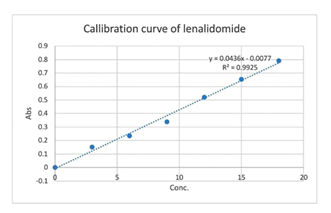
Figure1. Calibration curve of Lenalidomide in methanol
A calibration curve of Lenalidomide was prepared in methanol to determine its linearity and suitability for quantitative analysis using UV-visible spectrophotometry. The absorbance of standard solutions with concentrations ranging from 0 to 18 µg/mL was measured at 242 nm, which corresponds to the absorption maximum (λmax) of Lenalidomide in methanol. A linear relationship was observed between concentration and absorbance, indicating that the method follows Beer–Lambert’s law within the tested range. The calibration curve, as shown in Figure1, exhibited a well-defined straight line with good correlation, confirming the reliability of the analytical method for determining the concentration of Lenalidomide in subsequent formulations and release studies.
Pre-formulation Screening of Surfactants
Pre-formulation trials (Table 5) comparing Span 80 and Span 60 indicated that Span 80 produced significantly smaller vesicles
(106–254 nm) than Span 60 (348–488 nm) and achieved comparable drug entrapment efficiency. Therefore, Span 80 was selected for
further optimization due to its lower hydrophilic–lipophilic balance (HLB = 4.3), which promotes the formation of stable, flexible
bilayer vesicles with enhanced permeability. Subsequent results presented below focus on the optimization and characterization
of Lenalidomide-loaded niosomes prepared using Span 80.
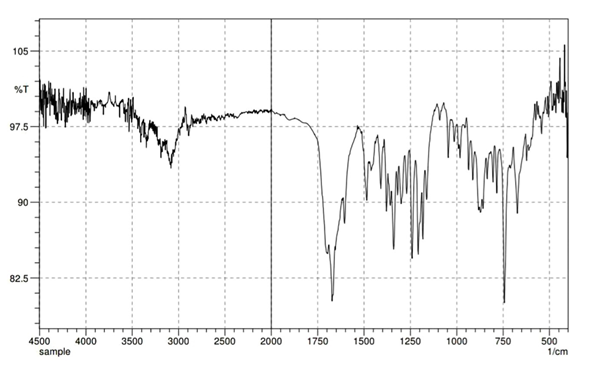
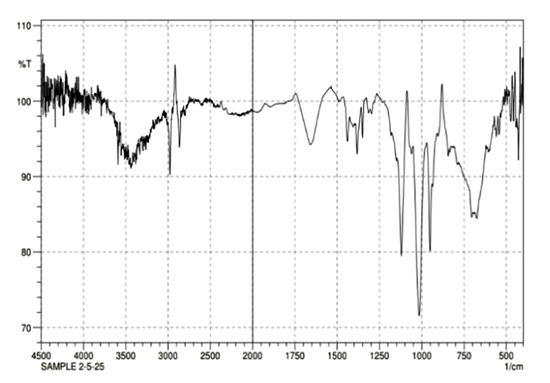
Fourier-Transform Infrared Spectroscopy (FTIR)
The FTIR spectrum of the sample was recorded using a Shimadzu instrument. The analysis reveals characteristic absorption peaks
which are consistent with the structural features of Lenalidomide. The presence of these peaks confirms the functional groups
expected in the compound and supports its identity. The FTIR of the API Lenalidomide are shown in the following figure 2a. Table
4 presents the FT-IR interpretation of Lenalidomide, comparing the reported and observed wavenumbers (cm⁻¹) for various
functional groups. It confirms the presence of characteristic stretches with observed peaks closely matching reported literature
values, indicating the drug’s structural integrity.
| Sr. no. | Stretching | Functional Group (cm⁻¹) | |
|---|---|---|---|
| Reported (cm⁻¹) | Observed (cm⁻¹) | ||
| 1 | C=O | 1700–1750 | 1690 |
| 2 | C=C | 1450–1600 | 1500 |
| 3 | C–O | 1000–1300 | 1079.81 |
| 4 | C–H | 700–900 | 755.34 |
| 5 | C–N | 1200–1350 | 1311.59 |
| 6 | N–H | 3300–3500 | 3365.48 |
| Sr. no. | Stretching | Functional Group (cm⁻¹) | |
|---|---|---|---|
| Reported (cm⁻¹) | Observed (cm⁻¹) | ||
| 1 | C=O (Amide) | 1650–1750 | 1655 |
| 2 | C=C | 1450–1600 | 1595 |
| 3 | C=O (Ester) | 1720–1750 | 1732 |
| 4 | C–H | 2850–2950 | 2920 |
| 5 | C–O–C | 1050–1250 | 1100 |
| 6 | N–H | 3300–3500 | 3410 |
Table 1 and 2 presents the FT-IR interpretation of Lenalidomide, comparing the reported and observed wavenumbers (cm⁻¹) for various functional groups. All these peaks combined indicate that the active chemical properties of Lenalidomide and the components of niosomes are intact and properly introduced, with no significant chemical or chemical interaction or shift in peaks and evidence supporting the physical entrapment mechanism process, as opposed to any sort of covalent processing of the formulation.
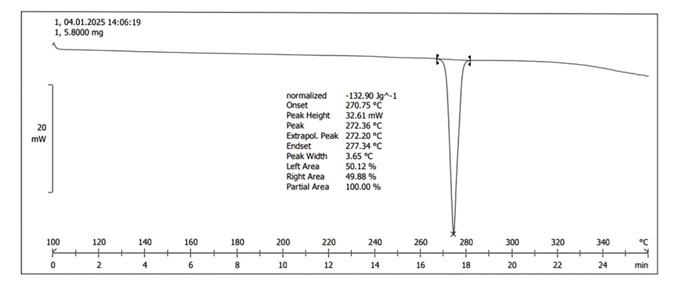
Figure3a shows the sharpness and narrow peak width (3.05 °C) suggest that the API is thermally pure with minimal impurities. The enthalpy value represents the energy absorbed during melting. A single, sharp peak with a narrow temperature range between onset and endset further confirms the homogeneity of the API. The sample exhibits a distinct and sharp melting endotherm at 272.36 °C, indicating high purity and crystalline nature. This information can be useful in confirming the identity of the compound and its suitability for formulation development.
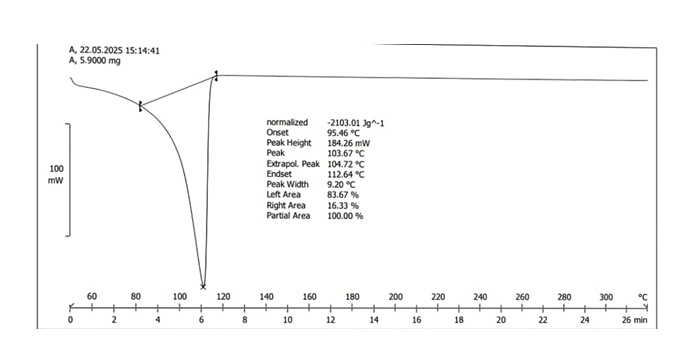
Figure3b. DSC of Lenalidomide loaded niosomes. The DSC thermogram of the niosomal formulation showed a completely different thermal behavior. The characteristic melting peak of pure Lenalidomide was absent, and instead, a new broad endothermic peak was observed at 103.57 °C, with an onset at 95.46 °C and an endset at 112.46 °C. The absence of the melting peak of pure Lenalidomide in the niosomal formulation suggests that the drug was successfully encapsulated within the niosomal bilayer. The shift in the thermal peak indicates that Lenalidomide may be present in an amorphous or molecularly dispersed form, rather than in its original crystalline state. The new thermal event around 103.5 °C could be attributed to the phase transition of the surfactant/cholesterol bilayer or interactions between the drug and lipid matrix. The drug-excipient interaction may lead to improved solubility and bioavailability, which is often desirable in pharmaceutical formulations.
Evaluation of parameters of all batches
All prepared batches of niosomes were evaluated for parameters such as particle size, zeta potential and drug content. Results are shown in table 3.
| FORMULATION | PARTICLE SIZE (in nm) | ZETA POTENTIAL (in mV) |
|---|---|---|
| F1 | 220.17 | -30.71 |
| F2 | 318.41 | -32.87 |
| F3 | 254.18 | -31.69 |
| F4 | 177.1 | -30.5 |
| F5 | 250.84 | -31.23 |
| F6 | 250.84 | -31.23 |
| F7 | 273.57 | -30.55 |
| F8 | 252.28 | -29.73 |
| F9 | 318.41 | -32.87 |
| F10 | 232.67 | -30.87 |
| F11 | 252.28 | -29.73 |
| F12 | 273.57 | -30.55 |
| F13 | 228.74 | -28.23 |
| F14 | 220.17 | -30.71 |
Above results indicates that batch B4 shows acceptable results, here selected as Optimized formulation.
32 Full factorial design:
Response 1: Particle size
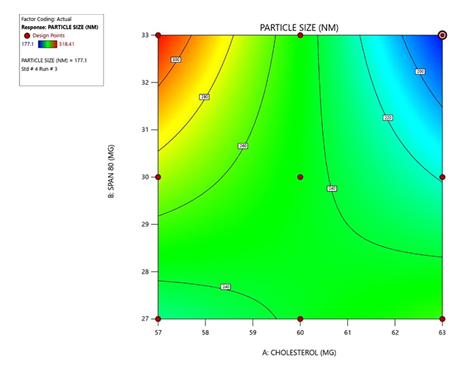
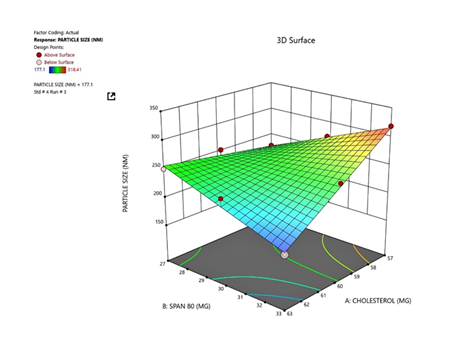
The visualization of interactive effects of Cholesterol & Span 80 on particle size are shown in figure4a and 4b
Response 2: Zeta potential
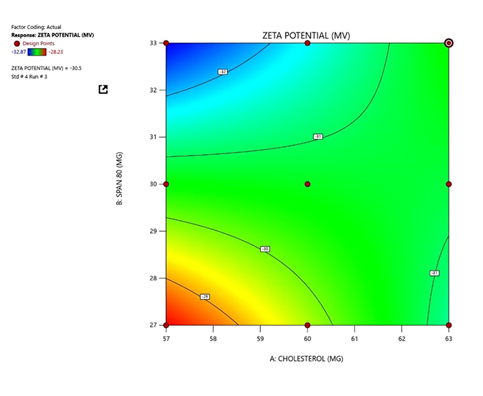
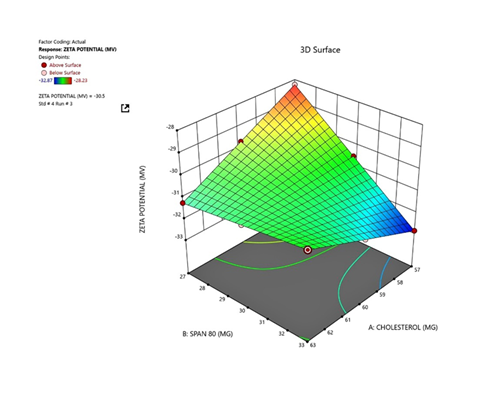
The visualization of interactive effects of Cholesterol & Span 80 on zeta potential are shown in figure5a and 5b
Optimization of Niosomal Formulation Using 3² Full Factorial Design
A 3² full factorial design was utilized to study the combined influence of Span 80 and cholesterol concentrations on the physical
characteristics of niosomes. The experimental outcomes for all nine formulations (F1–F14) are presented in Table 3.
Response 1: Particle Size
As shown in the contour and 3D response surface plots (Figure. 4a and 4b), an increase in Span 80 concentration (X₁) resulted in
a decrease in particle size, suggesting that higher surfactant content enhances vesicle flexibility and reduces interfacial
tension, thereby promoting the formation of smaller niosomes. Conversely, increasing cholesterol concentration (X₂) caused a
slight increase in particle size, as the rigid bilayer formed by excess cholesterol limits curvature and expansion, producing
larger vesicles. Therefore, an optimal Span 80-to-cholesterol ratio is necessary to maintain vesicle stability and uniform
nanometric size.
Final equation in terms of coded factors is as follows
Particle Size = +245.33+28.24*A[1]-3.12*A[2]1.38*B[1]-3.19*B[2]-43.46*A[1]B[1]+11.45*A[2]B[1]+3.19A[1]B[2]
-18.85*A[2]B[2]
Response 2: Zeta Potential
The response surface plots for zeta potential (Figure. 5a and 5b) indicated that both Span 80 and cholesterol significantly
influenced surface charge. A moderate increase in Span 80 led to a more negative zeta potential, improving electrostatic
stabilization of vesicles. Cholesterol also enhanced zeta potential up to an intermediate level, beyond which no substantial
improvement was observed—likely due to charge shielding within the bilayer. Among all batches, formulation B4 (33 mg Span 80
and 63 mg cholesterol) showed the optimal combination, achieving the smallest particle size (177.10 nm) and high zeta
potential (–30.50 mV), indicating excellent physical stability and bilayer integrity.
Final equation in terms of coded factors is as follows:
Zeta potential = -30.71+0.16*A[1]-1.11E-003*A[2]+0.98*B[1]-1.111E-003*B[2]+1.34*A[1]B[1]+1.111E-003*A[2]B[1]+1.111E-003*A[1]B[2]+1.111E-003*A[2]B[2]
Evaluation of Optimized batch:
Visual Appearance:
Dispersion of niosomes was visually inspected and its appearance was seen as white turbid solution.
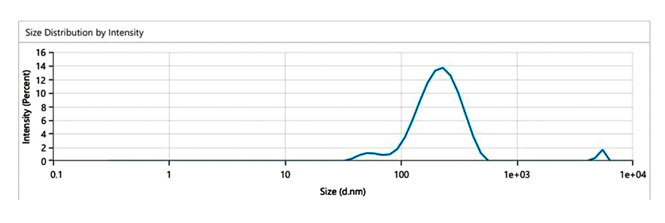
Particle size
Figure6 displays particle size measurement results of the prep.ared niosomes. The particle size of the samples ranged between
177.10 and 318.41 nm. The PS of niosomes was affected by many factors, such as the cholesterol amount in the formula. The vesicles
formation and properties are well kno.wn to be affected by the HLB of the used surfactant.
Polydispersity index (PDI) of niosomes ranged between 0.2 and 0.6, indicating that the produced niosomes were uniform
in size and homogeneous. A PDI.≤0.5 is regarded as suitable for drug delivery applications because it demonstrates a relatively
homogeneous and uniform distribution of nanocarriers. To provide proper particle distribution, the optimal formul.ation must
have a PDI valu.e≤0.5.
Zeta potential
Niosomes were physically stable since the ZP values of all formulations ranged from – 32.87 to – 28.23 mV. Cholesterol
had a significant effect on ZP with a p val.ue of 0.0.094. Zeta potential increased, as an absolute value, by increasing the
cholesterol amount leading to enhancing niosomes stability. As a result, cholesterol is an important excipient in the preparation
of niosomes because it enhances the stability of niosomes bilayers and reduces drug leakage due to the retarded solute
permeability of these vesicles’ aqueous core.
Entrapment Efficiency
After the vesicles were broken up with Triton X-100 (or propanol) and quantitative drug analysis was performed, the entrapment
efficiency (EE%) of lenalidomide-loaded niosomes was found to be 80.20±2.53%. The data were expressed as mean ± standard
deviation to account for experimental variability, and this value is the mean entrapment efficiency derived from several
independent measurements (n = 3). The reliability of the niosome preparation procedure is confirmed by the comparatively
low variability seen across duplicates.
The composition of the formulation is responsible for the high entrapment efficiency. The addition of Span 80, a non-ionic surfactant with a low hydrophilic–lipophilic balance (HLB), promotes the development of persistent, hydrophobic bilayers, which are especially useful for encasing drugs that are poorly soluble in water, such lenalidomide. Additionally, adding cholesterol to the niosomal membrane reduces drug leakage and membrane permeability by increasing bilayer stiffness and packing density. Additionally, cholesterol strengthens the bilayer's hydrophobic environment, which facilitates more lenalidomide sequestration and adds to the noted rise in EE%. (Mokale V. Niosomes as an ideal drug delivery system. J Nanosci Res Reports SRC/JNSRR-126. 2021.)
There are a number of reasons why about 20% of the medication was not caught. These include (i) lenalidomide's restricted solubility and partitioning during vesicle formation, which leaves a portion in the external aqueous phase; (ii) the bilayer domain becoming saturated, beyond which more drug cannot be added without compromising vesicle stability; and (iii) unanticipated process-related losses during the hydration, separation, or purification stages. For niosomal systems, an entrapment efficiency of about 80% is regarded as high, especially for hydrophobic medications. Depending on the kind of surfactant, cholesterol level, and preparation technique, reported EE% values for comparable niosome-based formulations usually fall between 60% and 90%. As a result, the EE% attained in this investigation is at the upper end of the reported range, suggesting that the developed formulation's efficiency is supported and drug loading is successfully enhanced by the optimised combination of Span 80 and cholesterol.[18]
Drug Content
Drug content was determined for all the batches. It was found in the range of 78.18±1.5 to 86.36±2.34. The maximum drug release was found to be 86.36 for F4 batch.
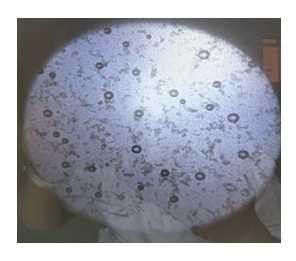
Figure7. Optical microscopy of LEN loaded niosomes
The microscopy images revealed from figure 7 that the niosomes were predominantly spherical to slightly oval in shape, and they appeared as well-formed, discrete vesicles. The vesicles showed uniform distribution without any noticeable aggregation, indicating good formulation stability. The spherical morphology is suggestive of successful vesicle formation and appropriate self-assembly of the surfactant and cholesterol components.
In vitro drug release studies
The lenalidomide-loaded niosomal formulation and plain lenalidomide differ significantly in the in vitro drug release profile
(Figure8). The niosomal formulation had a higher and more sustained release, achieving virtually entire drug release by the
completion of the investigation, whereas the plain drug showed a comparatively slower and partial release, reaching roughly
65–70% over 12 hours. As is typical of vesicular drug delivery systems like niosomes, the release pattern from the niosomes
was biphasic, with an initial, quicker release followed by a longer, regulated phase [19,20].
The Higuchi and Korsmeyer-Peppas models showed a stronger correlation with the release data when fitted to different
dissolution kinetic models than with zero-order kinetics, suggesting that the release of lenalidomide from the niosomes
was primarily diffusion-controlled with a contribution from bilayer relaxation or reorganisation [21, 22]. This behaviour
implies that the surfactant–cholesterol bilayer modulates drug release in a sustained way by acting as a diffusional barrier.
In vitro permeation studies
There is progressive and uniform increase in the amount of the drug permeation with time. Lenalidomide loaded niosomes
showed significantly greater permeation i.e. 66.83% than plain Lenalidomide at 8 hours, this indicates enhanced permeation
profile. Figureure. 8 shows the graphical presentation of % cumulative percent permeability of Lenalidomide loaded
niosomes.
The purpose of the in vitro permeation investigation was to assess the niosomal formulation's capacity to improve drug transport
through a biological membrane model. Even though lenalidomide is mostly taken orally, measuring membrane permeation is important
to investigate the possibility of using niosomes to enhance drug absorption across lipidic biological barriers and to look into
other delivery methods, like transdermal or transmucosal administration, particularly for patients who might not tolerate oral
therapy. When comparing the niosomal formulation to the plain medication, the penetration data showed a significant improvement.
Lenalidomide's cumulative permeation from the niosomes reached roughly 66.8% at 8 hours, while the plain drug's permeability
was only 42.3%, suggesting a notable improvement in membrane transport. The presence of the non-ionic surfactant (Span 80),
which is known to interact with membrane lipids, increase membrane fluidity, and decrease diffusional resistance, thereby
facilitating drug permeation, and the smaller particle size of the niosomes, which increases surface area and contact with
the membrane, are both responsible for this enhancement [20, 23, 24].
But it's important to recognise the permeation model's limitations. The complex structure and barrier characteristics of
human skin or intestinal mucosa are not fully represented by the egg membrane employed in this study, which functions
as a simpler surrogate membrane. Therefore, additional research utilising more physiologically relevant membranes and
in vivo models is necessary to confirm the clinical and translational relevance of these findings, even though the
observed increase in permeation offers a strong preliminary indication of the ability of niosomes to enhance lenalidomide
permeability [25].
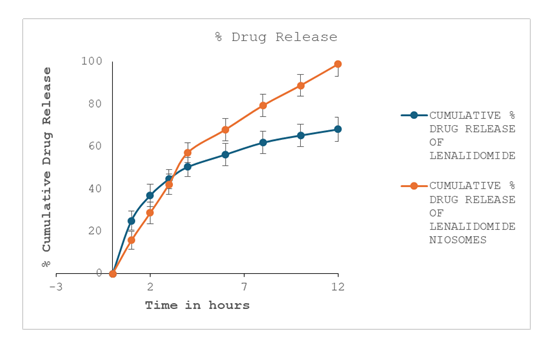
Figure8. Time vs Cumulative % drug release of plain Lenalidomide and Lenalidomide niosomes
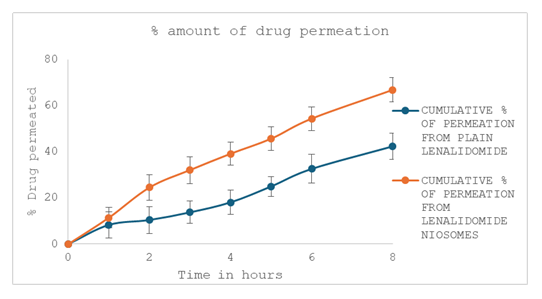
Figure9. Time vs Cumulative % Permeability of Lenalidomide niosome
Conclusion
The current investigation sought to develop, optimise and assess niosomes loaded with lenalidomide. The final formulation (F4)
was chosen based on the design space generated through a factorial design approach for optimisation. In comparison to previous
batches, the optimised formulation (F4) showed favourable properties such as ideal particle size and homogeneity, excellent
entrapment effectiveness, and an improved release profile, suggesting its potential to increase bioavailability and decrease
dosage frequency With a particle size of roughly 177.10 nm, niosomes made with Span 80 confirmed their nanoscale range and
suggested increased bilayer flexibility that might aid drug penetration through biological membranes. Additionally, after
niosomal encapsulation, the release profile showed a higher release rate.
In further research we will concentrate on in vivo studies, including pharmacokinetic and pharmacodynamic assessments in appropriate animal models of multiple myeloma, as the current study was restricted to in vitro evaluations. These investigations would be necessary to establish the Lenalidomide-loaded niosomal formulation's improved bioavailability, therapeutic efficacy, and safety, thereby validating its promise as a clinically feasible drug delivery system.
Materials And Methods
materials
Lenalidomide was purchased from J. K. Chemicals Gujarat India Cholesterol span 60 and span 80 was purchased from Analab fine
Chemicals The all other reagents were of analytical grade.
Pre-formulation studies
Pre-formulation studies involves the physical parameters (Appearance, solubility, melting point), Ultra-violet spectroscopy,
FT-IR (Fourier transform- Infrared) studies and DSC (Differential scanning calorimetry) to check the physical parameters and
compatibility of drug and excipients.
Formulation of Lenalidomide loaded niosomes
The drug was dissolved into an organic phase i.e. methanol, then it was mixed until completely dissolved. Next, sorbitan
mono stearate (Span 80), cholesterol, and lipid were added into the solution and mixed using a magnetic spinbar in a 20 mL
glass beaker. In a separate 50 mL glass beaker, purified water was heated at various temperatures using a hot plate with
magnetic stirring. The temperature of the water phase was selected based on the design requirement. The organic phase was
filled into a 10 mL syringe with a 26 G needle. The organic phase mixture was injected into the preheated aqueous phase
using predetermined parameters based on the experimental design. Mixing was carried out based on the values identified
from the design of experiment (DoE). In the last step of the process, the batch was cooled down to RT and the formulation
was stored in a suitable glass storage container.
Formulation trial batches of different ratios of span 80 and Span 60 were prepared as seen in table 4.
| Sr. no | Surfactant type | Surfactant to drug ratio | Particle size (nm) | Drug content (in %) |
|---|---|---|---|---|
| 1 | Span 80 | 1:0.5 | 189.20 | 82.26 |
| 2 | Span 80 | 1:1 | 106.0 | 85.23 |
| 3 | Span 80 | 1:2 | 254.40 | 79.18 |
| 4 | Span 60 | 1:0.5 | 435.77 | 84.49 |
| 5 | Span 60 | 1:1 | 348.03 | 81.86 |
| 6 | Span 60 | 1:2 | 488.0 | 83.76 |
| Factor | Symbol | Low (–1) | Medium (0) | High (+1) |
|---|---|---|---|---|
| Conc. of Span 80 (mg) | X₁ | 27 | 30 | 33 |
| Conc. of Cholesterol (mg) | X₂ | 57 | 60 | 63 |
The dependent variables (responses) were particle size (Y₁, nm) and zeta potential (Y₂, mV). The experimental design generated nine formulation trials (F1–F14), each representing a unique combination of the two independent variables (Table 6). The statistical analysis, model fitting, and generation of contour and 3D surface response plots were performed using Design-Expert® software (Version 13, Stat-Ease Inc., Minneapolis, USA). The optimized batch was selected based on achieving the smallest vesicle size, high absolute zeta potential, and satisfactory entrapment efficiency
Different experimental runs F1 to F14 were prep.ared as shown in table 6
| Sr. No. | Batches | Cholesterol Conc. | Span 80 |
|---|---|---|---|
| 1 | F1 | 0 | 0 |
| 2 | F2 | -1 | +1 |
| 3 | F3 | 0 | +1 |
| 4 | F4 | +1 | +1 |
| 5 | F5 | +1 | -1 |
| 6 | F6 | +1 | -1 |
| 7 | F7 | -1 | 0 |
| 8 | F8 | 0 | 0 |
| 9 | F9 | -1 | +1 |
| 10 | F10 | +1 | 0 |
| 11 | F11 | 0 | -1 |
| 12 | F12 | -1 | 0 |
| 13 | F13 | -1 | -1 |
| 14 | F14 | 0 | 0 |
Visual Appearance
Dispersion of niosomes was visually inspected to determine its appearance, turbidity and to see the presence of flocculation
and phase separation by taking dispersion in transparent container.
Drug content
10 mg equivalent was taken from prepared niosomal suspension and dissolved in 10 ml of methanol. These were
kept for the sonication and to check absorbance in the UV spectrophotometer.
Optical Microscopy
The ultrastructure of the niosomal vesicles was observed using the microscope. A slide of a dispersion was applied on to
a glass slide and this was covered with a cover slip. The eye piece magnification set to 10X and the objective lens to
40X was used.
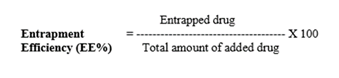
Entrapment
The efficiency of entrapping (EE%), can be regarded as the percentage that represents that segment of the amount of the drug
used and gets trapped within the niosomes. Centrifugation can be applied to eliminate free drug which has not been encapsulated
in the niosomal solution by applying dialysis procedure. In the phase the vesicles destroyed enable the drug that is loaded
in niosomes to be released. Niosomal suspension niosomes could be destroyed by addition of 0.1 per cent Triton X-100 or 50 percent
propanol. The loaded and free concentration of the drug can be measured by the UV spectrophotometer. In order to measure the
entrapment efficiency, it is calculated as follows:
Dispersion of size, Poly Dispersity Index and Measurement of Zeta potential:
To obtain a Size Dispersion, and Poly Dispersity Index (PDI), Dynamic light scattering was done. Zeta potential of
dispersion value is noted by the exposure of dispersion into electric field. The zeta potential will have a proportionate
relationship to the speed of the particles of the dispersion that will be inclined to stray to the electrode of opposite
polarity.
In vitro release studies
In vitro release of Lenalidomide from the niosomes was studied in phosphate buffer pH 6.8 for 8 h using United States
Pharmacopeia (USP) type II Paddle type apparatus using volume 900 mL, at 100 rpm and 37°C. Samples (5 mL) were withdrawn
through pipette at different time intervals and were assayed at 242 nm for Lenalidomide content spectrophotometrically.
In vitro permeation study:
The in vitro permeation study of the prepared niosomes was carried out using Franz diffusion cell through egg shell membrane
because the egg shell membrane resembles human stratum corneum as it consists mainly of keratin [26]. The membrane was
accordingly prepared before use [27]. The water in the outer jacket of the cell was warmed and set at 37 ± 1∘C throughout
the experiments to provide a skin surface temperature. Phosphate buffer solution of pH 6.8 was used as dissolution medium
in the receptor compartment. A 10mg equivalent of niosomes was taken and applied over the mounted membrane in diffusion cell.
After that, the samples were withdrawn from the receptor compartment at regulated intervals. The sampling schedule was at
0, 1 hour, 2 and then it was at every hour interval till 8th hour of release. One mL of the receptor solution was collected
as sample each time and simultaneously one mL of phosphate buffer solution was added back to the receptor cell for maintaining
the same initial volume of the receptor cell solution. The collected samples were analysed using UV-Vis spectrophotometer [28].
Acknowledgement
This work was supported by Alard School of Pharmacy, Alard University, Marunji Pune.
Author contributions
Conceptualization and experimental work: Sakshi wavare
Manuscript writing: Prof. Pallavi kaple, Dipali Kamble
Data analysis and interpretation (Results and Discussion): Dr. Shreeya Belwalkar
Supervision and overall guidance: Dr. Shreeya Belwalkar, Pratiksha More
Conflict of interest
The authors declare no conflict of interest
References
- Cosco D, Paolino D, Muzzalupo R, Celia C, Citraro R, Caponio D, Picci N, Fresta M. Novel PEG-coated niosomes based on bola-surfactant as drug carriers for 5-fluorouracil Biomedical microdevices. 2009 Oct;11(5):1115.
- Paolino D, Muzzalupo R, Ricciardi A, Celia C, Picci N, Fresta M. In vitro and in vivo evaluation of Bola-surfactant containing niosomes for transdermal delivery. Biomedical microdevices. 2007 Aug;9(4):421-33.
- Junyaprasert VB, Teeranachaideekul V, Supaperm T. Effect of charged and non-ionic membrane additives on physicochemical properties and stability of niosomes. AAPS pharmscitech. 2008 Sep;9(3):851-9.
- Waware SU, Singh S, Belwalker S, Kaple P. Role of Artificial Intelligence in Niosomes Development. J Pharm Res Rev Rep. 2025 Feb.;3(2).ISSN: 2583.-973X
- Vyas SP, Khar RK. Targeted and Controlled drug delivery: concepts and advances.
- Kuldharan RA, Belwalkar S, Singh S, Kaple P. Niosomes: A comprehensive review of their preparation, characterization, and applications in drug delivery. Int J Creative Res Thoughts. 2025 Apr.;13(4). ISSN: 2320.-2882
- Rajera R, Nagpal K, Singh SK, Mishra DN. Niosomes: a controlled and novel drug delivery system. Biological and Pharmaceutical Bulletin. 2011 Jul 1;34(7):945-53.
- Kazi KM, Mandal AS, Biswas N, Guha A, Chatterjee S, Behera M, Kuotsu K. Niosome: a future of targeted drug delivery systems. Journal of advanced pharmaceutical technology & research. 2010 Oct 1;1(4):374-80.
- https://go.drugbank.com/drugs/DB00480
- https://pubchem.ncbi.nlm.nih.gov/compound/Lenalidom
- Hideshima T, Mitsiades C, Tonon G, Richardson PG, Anderson KC. Understanding multiple myeloma pathogenesis in the bone marrow to identify new therapeutic targets. Nature Reviews Cancer. 2007 Aug;7(8):585-98.
- Chng WJ, Santana-Davila R, Van Wier SA, Ahmann GJ, Jalal SM, Bergsagel PL, Chesi M, Trendle MC, Jacobus S, Blood E, Oken MM. Prognostic factors for hyperdiploid-myeloma: effects of chromosome 13 deletions and IgH translocations Leukemia. 2006 May;20(5):807-13.
- Van Wier S, Braggio E, Baker A, Ahmann G, Levy J, Carpten JD, Fonseca R. Hypodiploid multiple myeloma is characterized by more aggressive molecular markers than non-hyperdiploid multiple myeloma Haematologica 2013 Oct;98(10):1586.
- Smadja NV, Fruchart C, Isnard F, Louvet C, Dutel JL, Cheron N, Grange MJ, Monconduit M, Bastard C. Chromosomal analysis in multiple myeloma: cytogenetic evidence of two different diseases Leukemia 1998 Jun;12(6):960-9.
- Fonseca R, Debes-Marun CS, Picken EB, Dewald GW, Bryant SC, Winkler JM, Blood E, Oken MM, Santana-Dávila R, González-Paz N, Kyle RA. The recurrent IgH translocations are highly associated with nonhyperdiploid variant multiple myeloma. Blood. 2003 Oct 1;102(7):2562-7.
- Chen N, Zhou S, Palmisano M. Clinical pharmacokinetics and pharmacodynamics of lenalidomide Clinical pharmacokinetics 2017 Feb;56(2):139-52.
- Teron C, Bhuyan A, Saikia P, Dutta SR, Gogoi H, Rongpi S. A Comprehensive Review on Niosomes in Drug Delivery and Recent Advancements. Journal of Drug Delivery & Therapeutics. 2024 Sep 1;14(9).
- Nguyen MH, Le TH, Nguyen TP, Le TN, Nguyen TY, Nguyen KA, Pham TT, Le MT. Niosomes: recent advances and applications in targeted drug delivery. VNUHCM Journal of Science and Technology Development. 2024 Sep 30;27(3):3507-34.
- Sharma, A., & Sharma, U. S. (1997). Niosomes: A Controlled and Novel Drug Delivery System. BioDrugs, 9(6), 397–407.
- Moghassemi, S., & Hadjizadeh, A. Niosomes as Nanocarriers for Drug Delivery: A Review of Fundamentals, Properties, and Clinical Applications. Journal of Controlled Release, 185, 22–36 (2014).
- Siepmann, J., & Peppas, N. A. (2011). Higuchi Equation: Derivation, Applications, and Limitations. International Journal of Pharmaceutics, 418(1), 6–12.
- Korsmeyer, R. W., Gurny, R., Doelker, E., Buri, P., & Peppas, N. A. (1983). Mechanisms of Solute Release from Porous Hydrophilic Polymers. International Journal of Pharmaceutics, 15(1), 25–35.
- Honeywell-Nguyen, P. L. & Bouwstra, J. A. (2005). Vesicles as a Tool for Transdermal and Dermal Delivery. Drug Discovery Today: Technologies, 2(1), 67–74.
- Touitou, E. & Godin, B. (2009). Enhancement in Drug Delivery Across the Skin Using Liposomes. Journal of Drug Delivery Science and Technology, 19(3), 185–196.
- Chandrasekaran, P., & Rajan, V. (2016). In vitro permeation studies using egg membrane for preliminary screening of formulations. International Journal of Pharmaceutical Investigation, 6(4), 224–229.
- Haigh JM, Smith EW. The selection and use of natural and synthetic membranes for in vitro diffusion experiments. European journal of pharmaceutical sciences. 1994 Dec 1;2(5-6):311-30.
- Shah V, Raval S, Peer S, Upadhyay UM. A comparative evaluation of different membranes for their diffusion efficiency: An in vitro study. Pharma Sci. Monit. 2010;1:41-9.
- Suryadevara PK. Formulation and evaluation of antiemetic patch comprising ondansetron hydrochloride [MS thesis]. KLE University, Belgaum, India. 2010.